Qatium · JUL 2025 — NOV 2025 · Shipped
A minimum night flow monitor for detecting leakage
Turning an existing data point into an actionable leakage-monitoring workflow.
Minimum night flow already existed in Qatium, but operators couldn't compare zones or confidently decide where to investigate. I designed a multi-zone monitoring workflow that turned an isolated metric into a prioritisation tool.
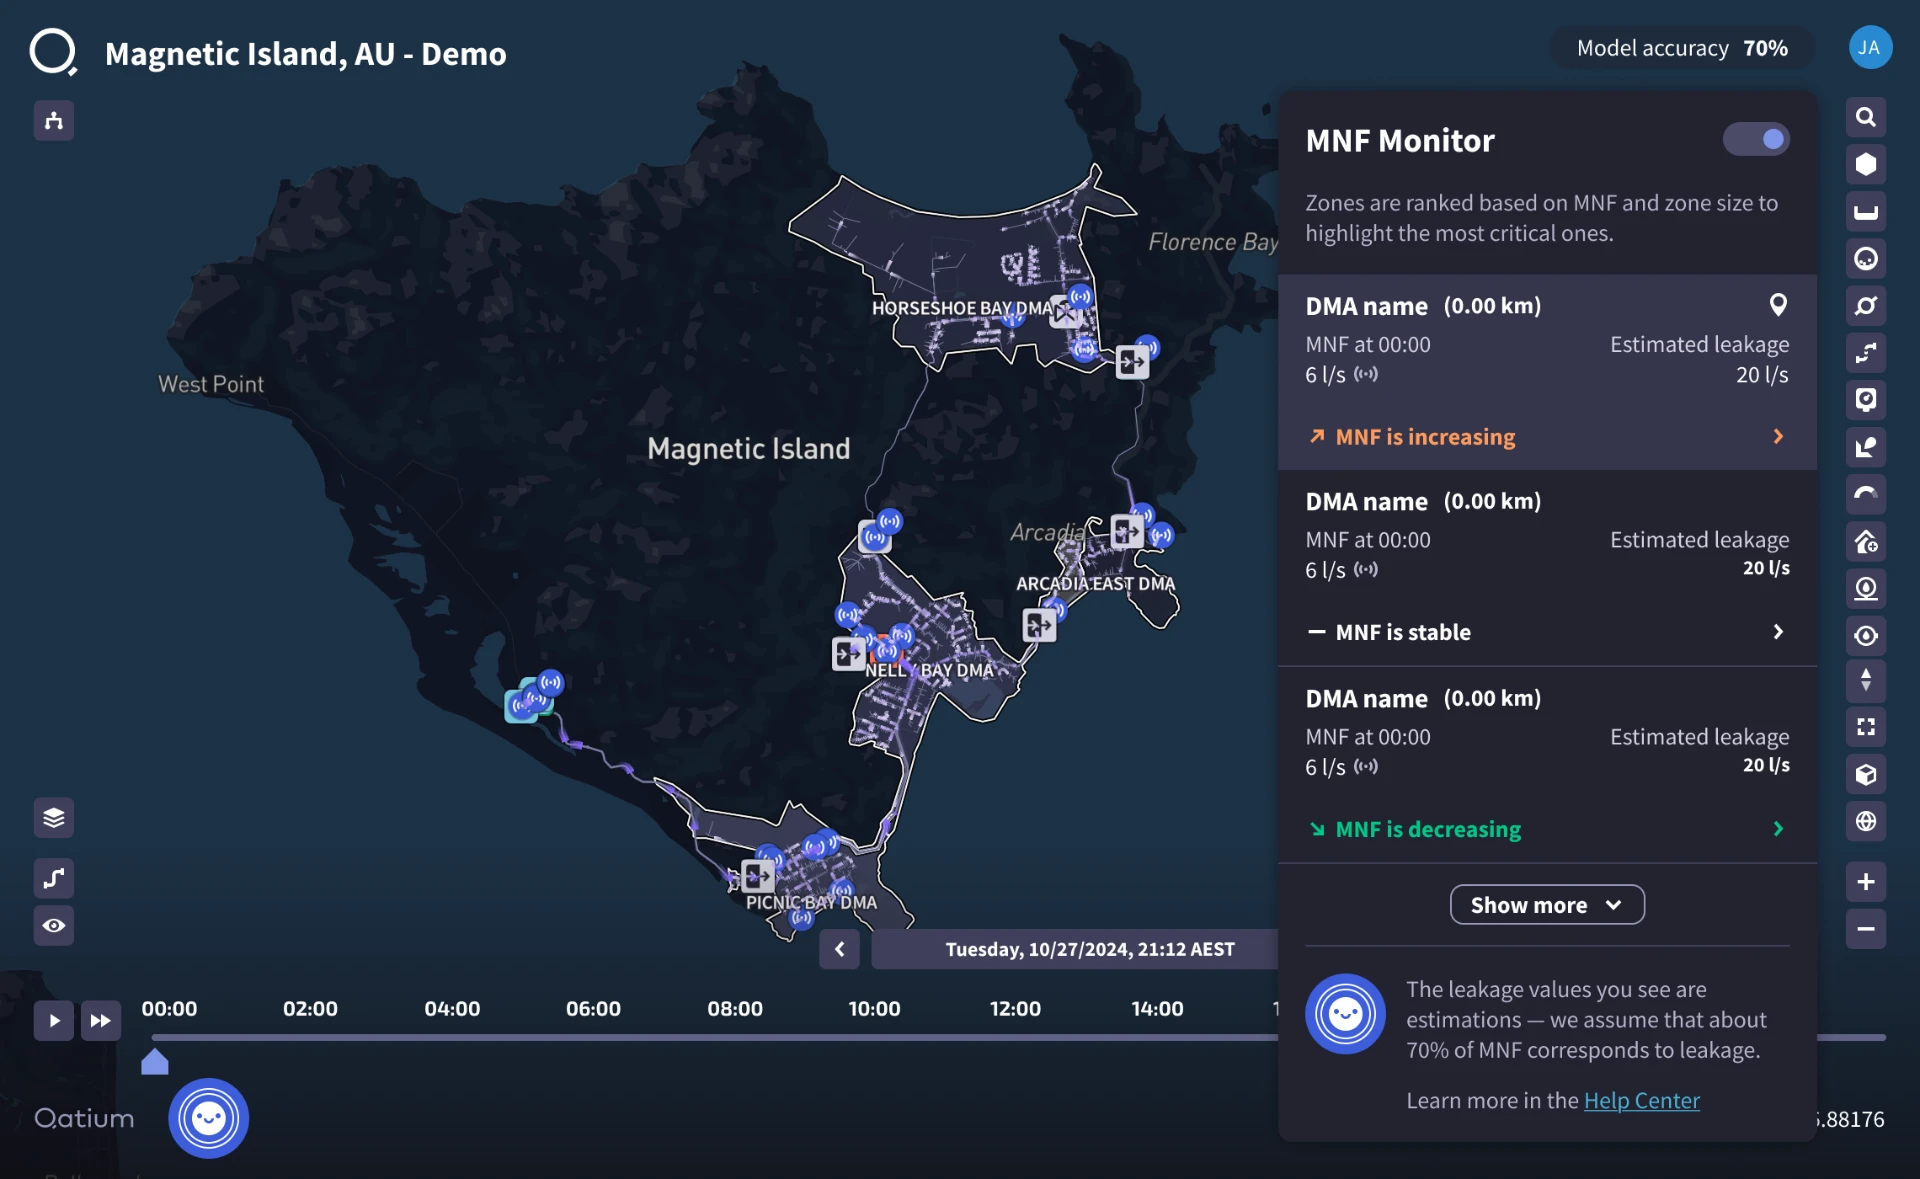
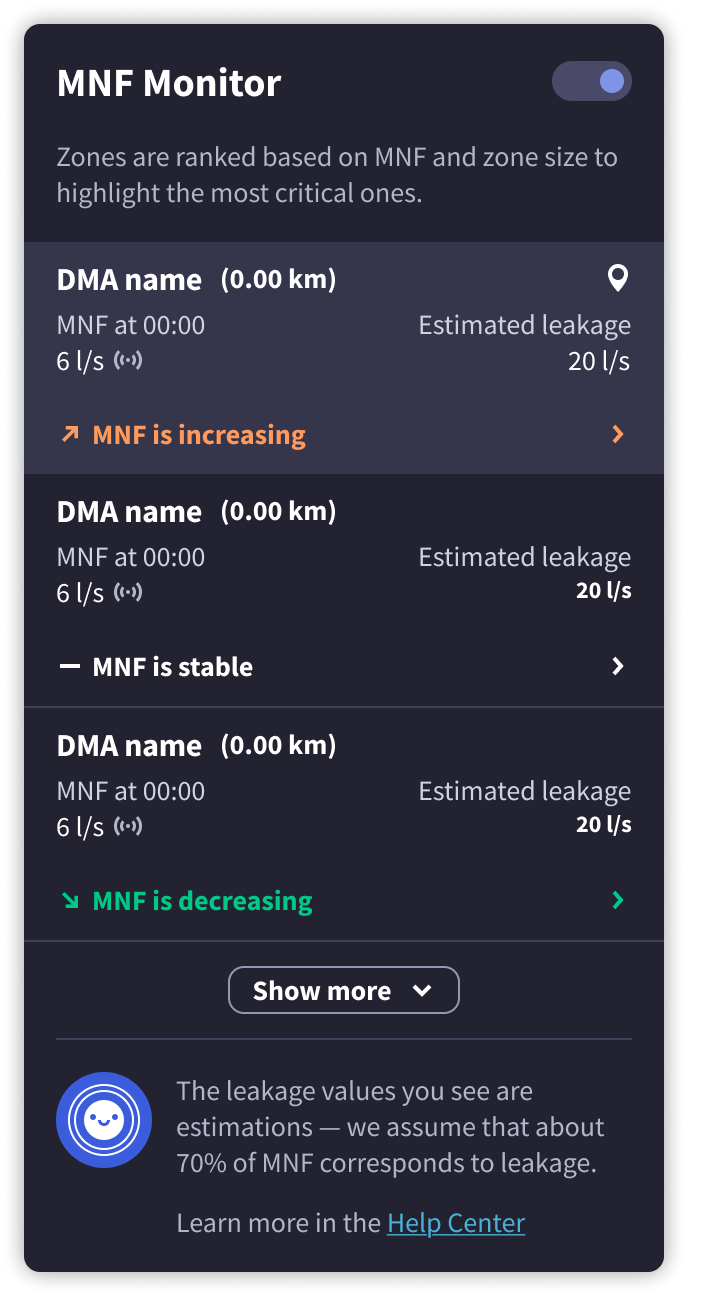
The monitor ranks district metered areas by estimated leakage relative to network length, with trend labels and the 70% leakage assumption made explicit.
- Role
- Senior Product Designer
- Team
- Project Manager, engineers, domain experts
- Scope
- Discovery to delivery
- Surface
- Web app, B2B SaaS
Overview
Qatium is a water network management platform used by utilities and operators. Minimum night flow is a metric that can signal leakage: when legitimate consumption is at its lowest, whatever is still flowing may be a loss.
I led the design end to end, from discovery with field experts through to delivery.
The user problem
Operators often find there is a leak or burst when a customer calls the provider, when the water is already running down the street. The initial leak might have been there for years, going unnoticed — a slow bleed of a scarce resource that of course goes unbilled.
Challenge
Minimum night flow was already available in our data; it was a value we ingested, but it was not reflected in the UI at all.
The first compromise
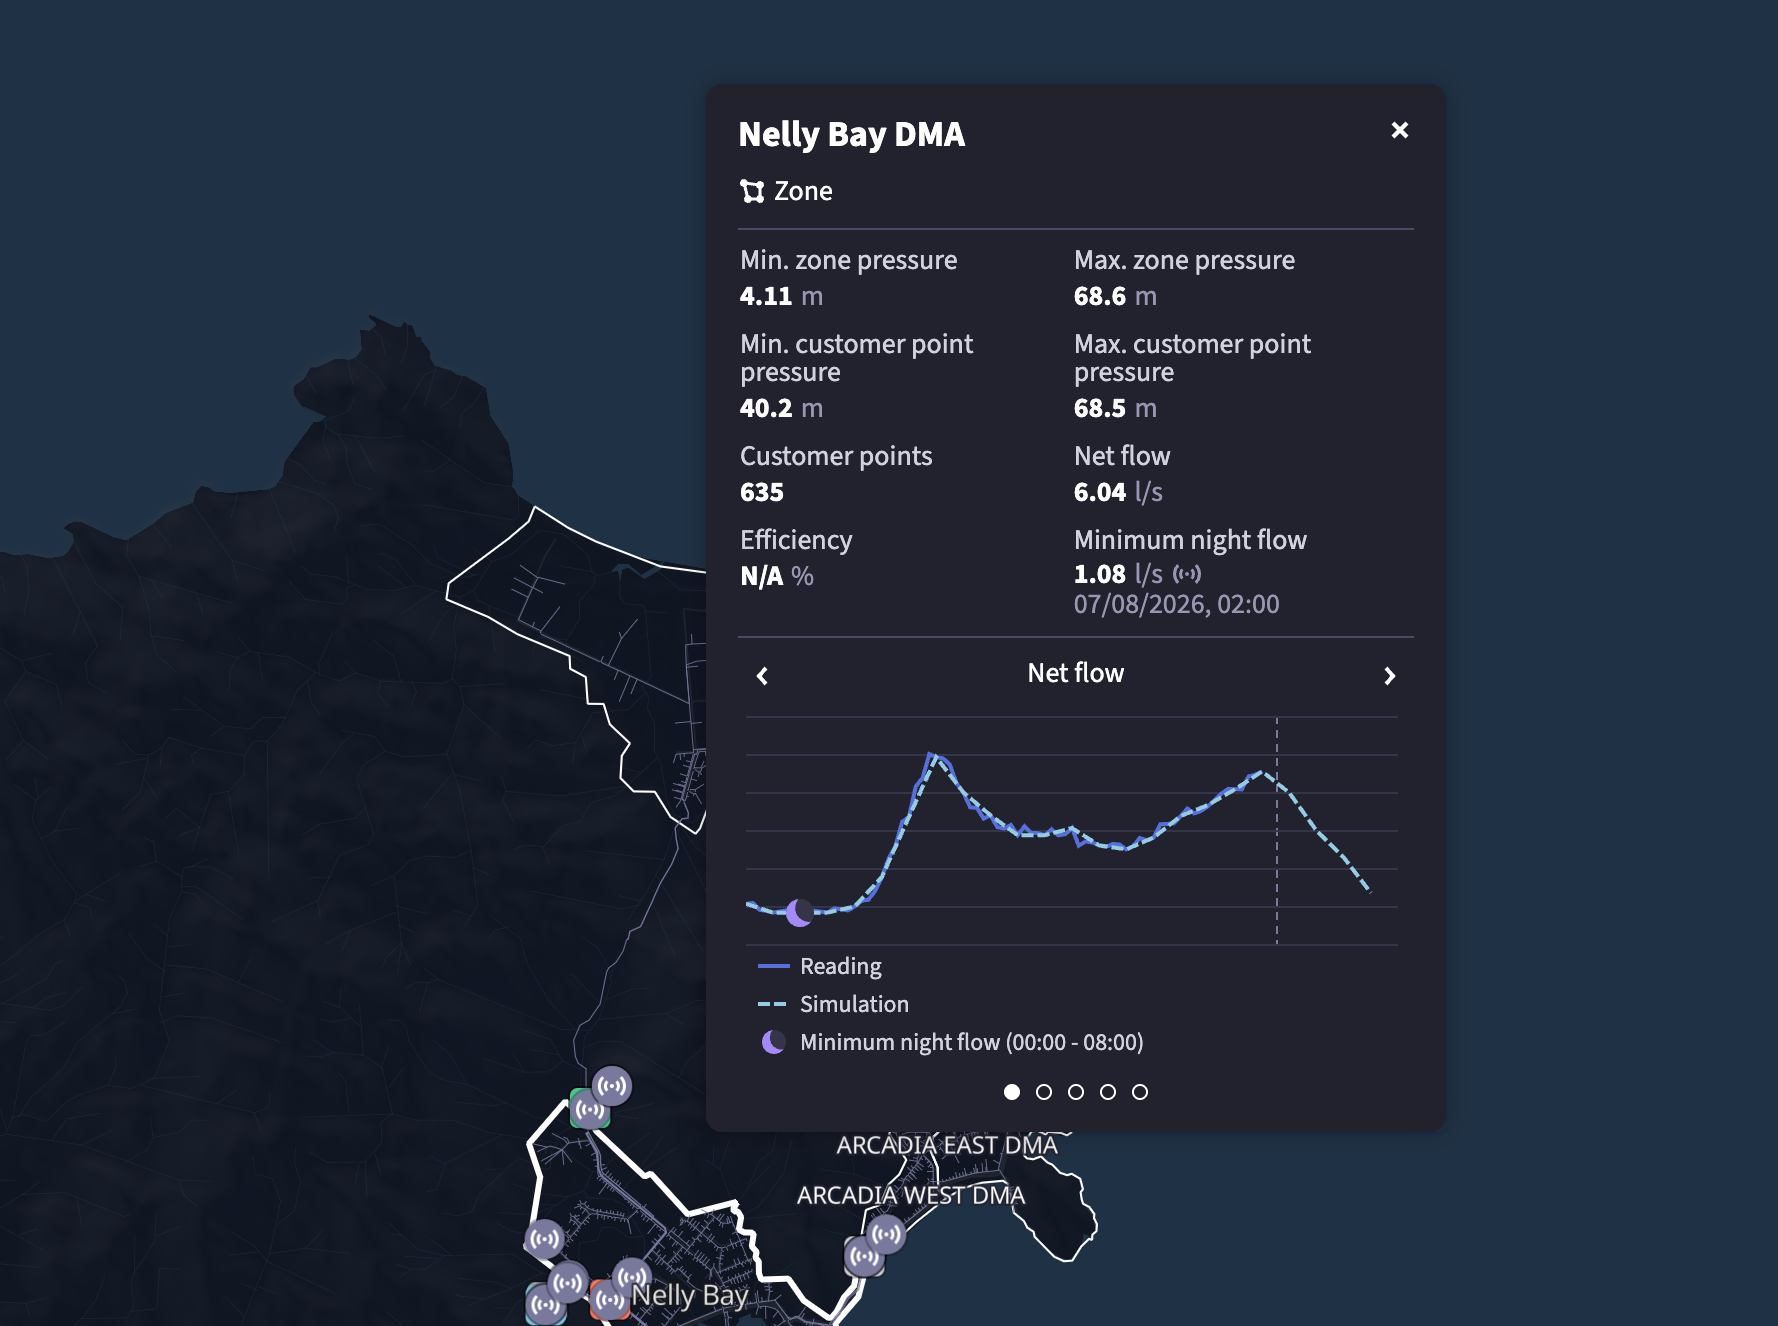
Initially, we surfaced minimum night flow inside the existing district metered area popover. This let us validate the data without building a new workflow — but it also exposed a limitation: operators couldn't compare zones efficiently.
Business context and constraints
This project supported KR5, a company objective focused on expanding Qatium's Non-Revenue Water (NRW) capabilities and helping utilities measure and quantify losses.
A full water balance needs metered consumption at every customer point. Most networks don't have that, so we scoped the tool to what the available flow data could support: identify, locate and quantify estimated leakage, then decide whether it justified a repair.
It runs wherever there are defined district metered areas and flow sensors with valid readings at the lowest consumption times. It shipped incrementally alongside other product initiatives rather than as a standalone release.
Goals
Identify & quantify
Identify and quantify estimated leakage at district metered area level.
Compare & prioritise
Compare and prioritise multiple zones.
Normalise
Normalise leakage by network length.
Validate repairs
Validate whether leakage settles after a repair.
Product principle
Scope the claim to the data.
Leakage estimation, not water balance. The tool does not imply or calculate non-revenue water.
Research
What I needed to understand
- What makes an operator trust a leakage signal enough to investigate?
- What comparisons are actually meaningful?
- What information is needed to move from detection to decision to repair?
- Where could this overlap with the Estimated Leakage plugin?
I ran working sessions with hydraulic experts and mapped the journey from noticing an anomaly to dispatching a crew and confirming the repair worked. I also compared the concept against the existing Estimated Leakage plugin to understand overlap.
Operators struggled to separate real leakage from fraud, meter errors and seasonal shifts — a signal that doesn't over-claim is easier to act on.
What I found
- The hard part wasn't spotting a number, it was trusting it enough to send someone out
- Closing the loop mattered as much as detection
- Estimated Leakage covers similar ground but requires emitters, which many utilities don't have
What makes the signal meaningful
- An absolute minimum night flow value means little on its own. A zone read against its own history is what signals change.
- Big zones also leak more in absolute terms, so comparison had to be normalised by network length.
- Unlike the emitter-based Estimated Leakage approach, this works without a hydraulic model: it needs only flow meters on each zone inlet and outlet, and it stops at estimating losses inside the zone.
From signal to action
I mapped the workflow from noticing an anomaly to deciding whether the loss justified a repair. This helped us design around the operator's actual decision rather than around the metric itself.
In parallel, I aligned with Content Design and hydraulic experts on the wording, so the numbers read as estimates and the tool wouldn't collide with Estimated Leakage.
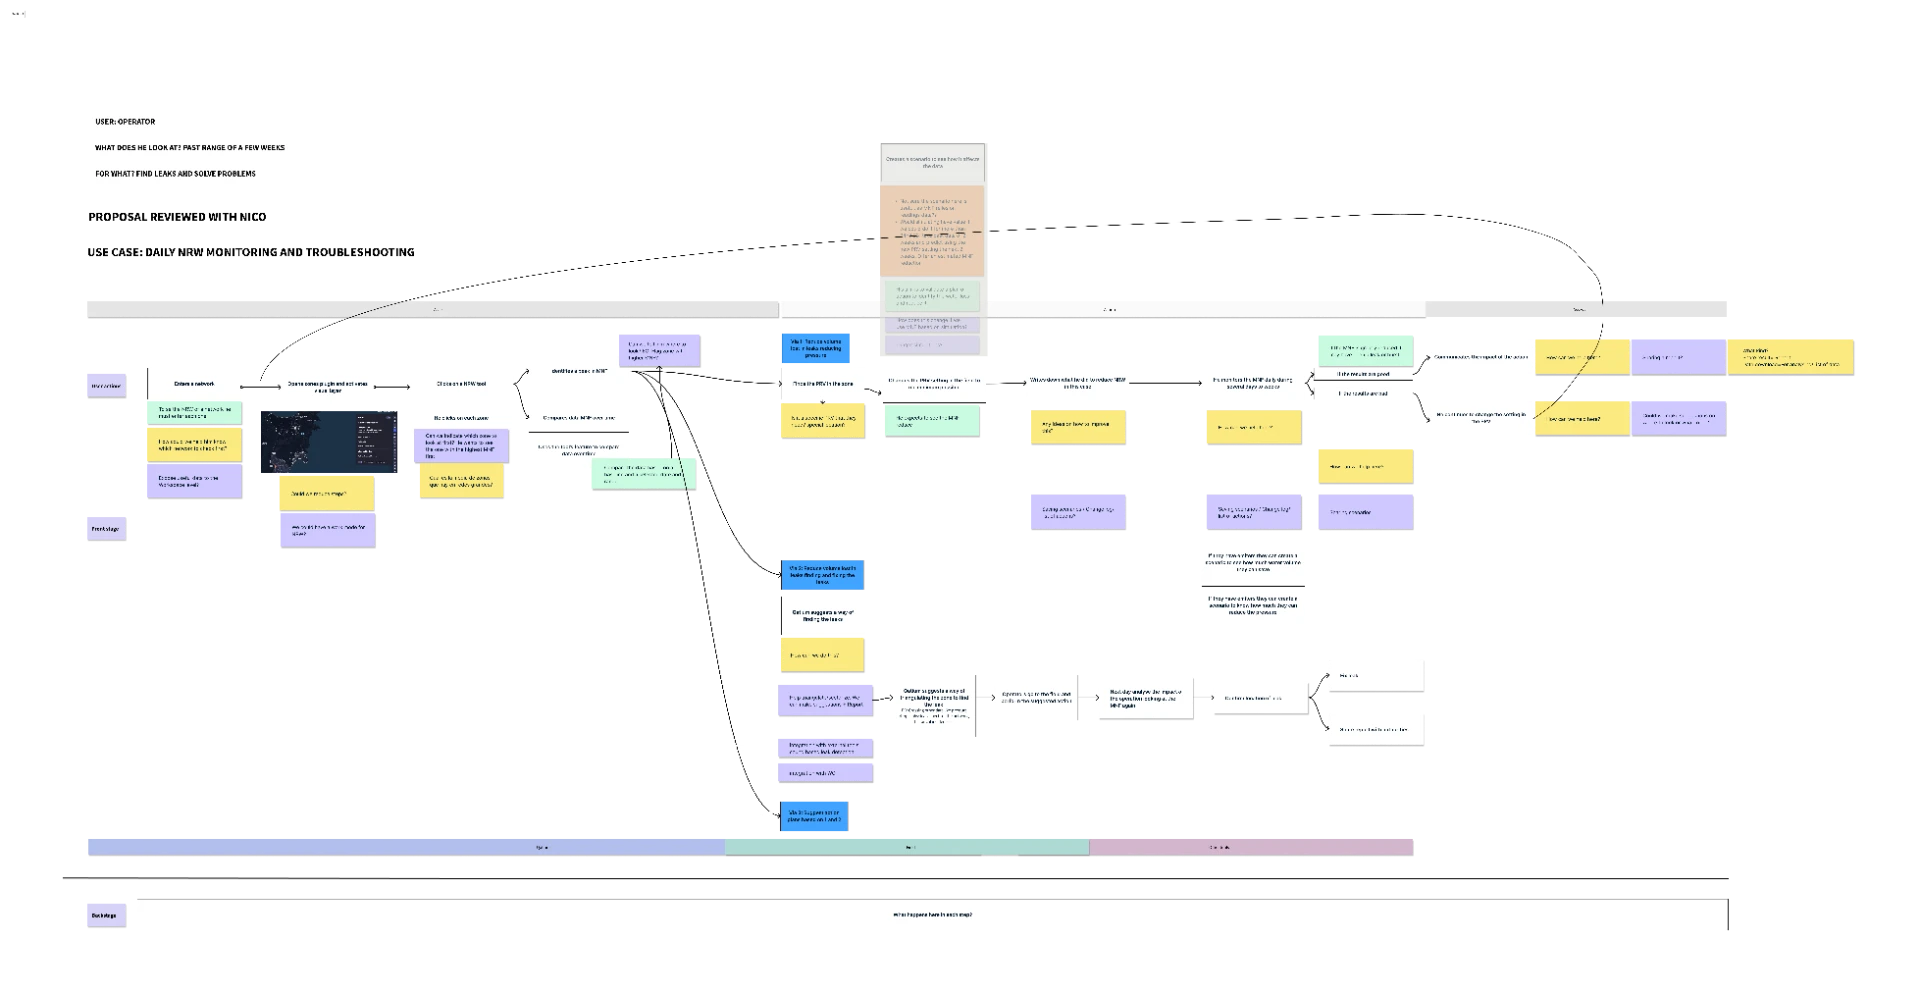
A metric became a product when operators could compare it.
Iterations
From one zone to many
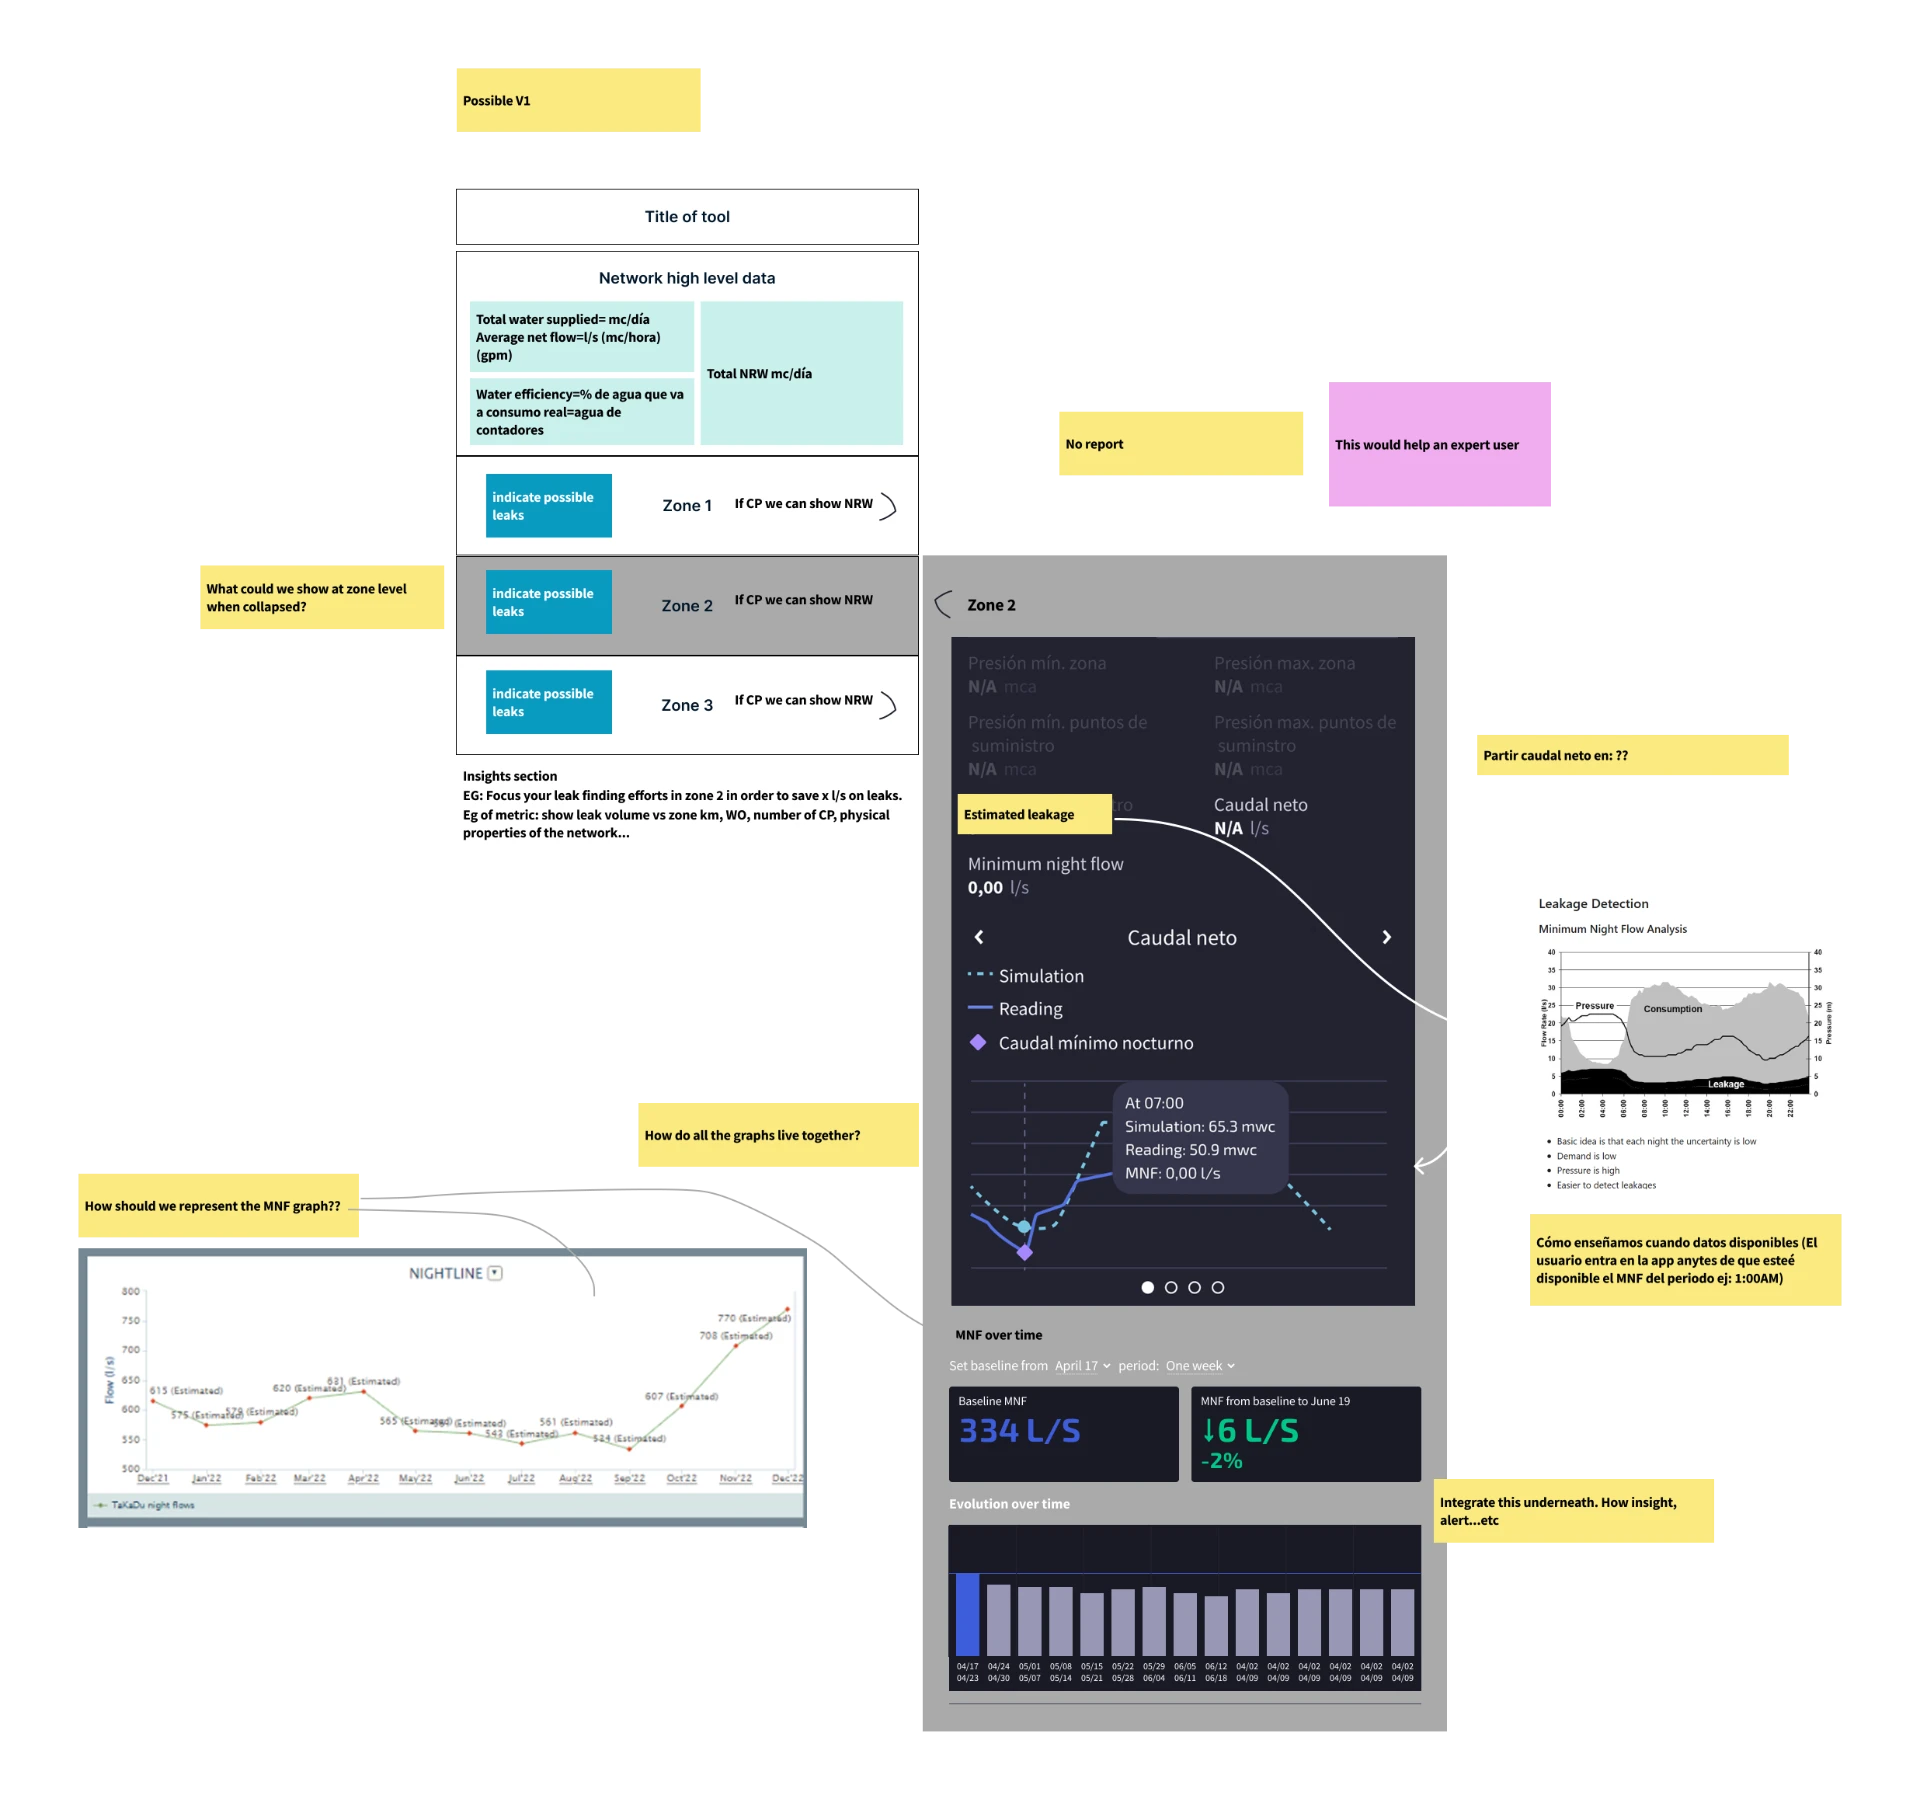
The first concept repeated what the popover already did: one zone, one number. It never answered the operator's real question — which zone deserves a crew today — so the structure moved to a network summary above a comparable, sortable zone list.
Making trends auditable
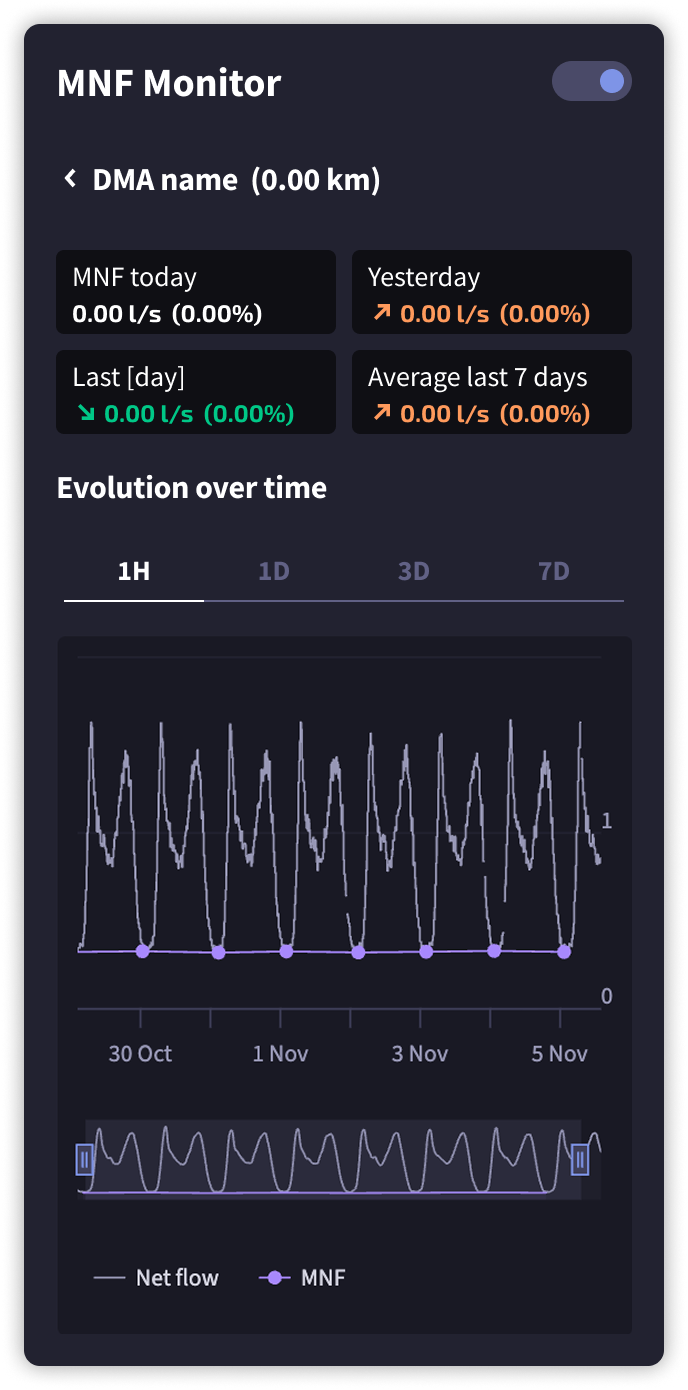
We defined explicit thresholds and showed today's value against yesterday, the same weekday last week, and the seven-day average, so every trend label could be traced back to the underlying data.
- Increasing
- +0.3 l/s accumulated over 7 days
- Stable
- within ±0.3 l/s
- Decreasing
- −0.3 l/s vs. the same day last week
From signal to context
The zone detail became a time-series of minimum night flow against net flow, with date range, zoom and legend controls, and the selected zone highlighted on the map so operators can place it immediately.
Collaboration
I worked directly with engineers and hydraulic domain experts throughout the project, aligning product goals, domain accuracy and technical feasibility.
The harder part was aligning the team around a simpler approach when a more sophisticated, but less accessible, alternative already existed. I moved us toward the minimum night flow route by making the trade-off explicit. A coarser estimate in exchange for reaching more users.
Key decisions
Scope to leakage estimation
Without metered consumption at every customer point, a water balance wasn't defensible. An approximate NRW figure would have been worse than no figure.
Make uncertainty visible
Label the numbers as estimates and expose the 70% minimum-night-flow assumption rather than hiding the model behind a confident figure.
Build on minimum night flow
Use minimum night flow instead of emitters, accepting a coarser estimate in exchange for reaching more users.
Make trends auditable
Define trend with explicit thresholds and visible comparisons so every highlighted zone can be traced back to the data.
Design for comparison first
Prioritisation, pressure-drop context, recommendations, reports, and work-order integration need a standalone workflow. This tool was the first step towards achieving these capabilities.
Outcome
Adoption
Monthly unique operators activating the plugin grew month-over-month by +50% in March 2026, +125% in May and +12.5% in July.
A comparable, actionable signal
We provided operators with the context needed to rank zones and decide where to investigate without opening each one.
Customer value
In customer calls, teams described catching worsening leaks before complaints or bursts, targeting the worst zones instead of sweeping the whole network, and using the trend to confirm a repair worked — even with only daily or monthly consumption data.
It shipped as the MNF Monitor plugin. Operators can also use it after a repair to check whether the minimum night flow has settled.
It also opened a roadmap that wasn't reachable from a tooltip: pressure-drop context, automated recommendations, and report generation tied to work orders.
Lessons learned
Scope the claim to the data
A tool that says less and is right earns more trust than one that estimates NRW from assumptions.
Make the model visible
Stating the 70% assumption made the estimate more usable, not less. Experts trust a visible model over a clean number.
Comparison creates product value
Surfacing data is only worth doing if it changes what the user can compare or decide.
Reflection
When the underlying data is uncertain, it's important to be precise about what the product can responsibly claim.